
Canadian Hardiness Zones
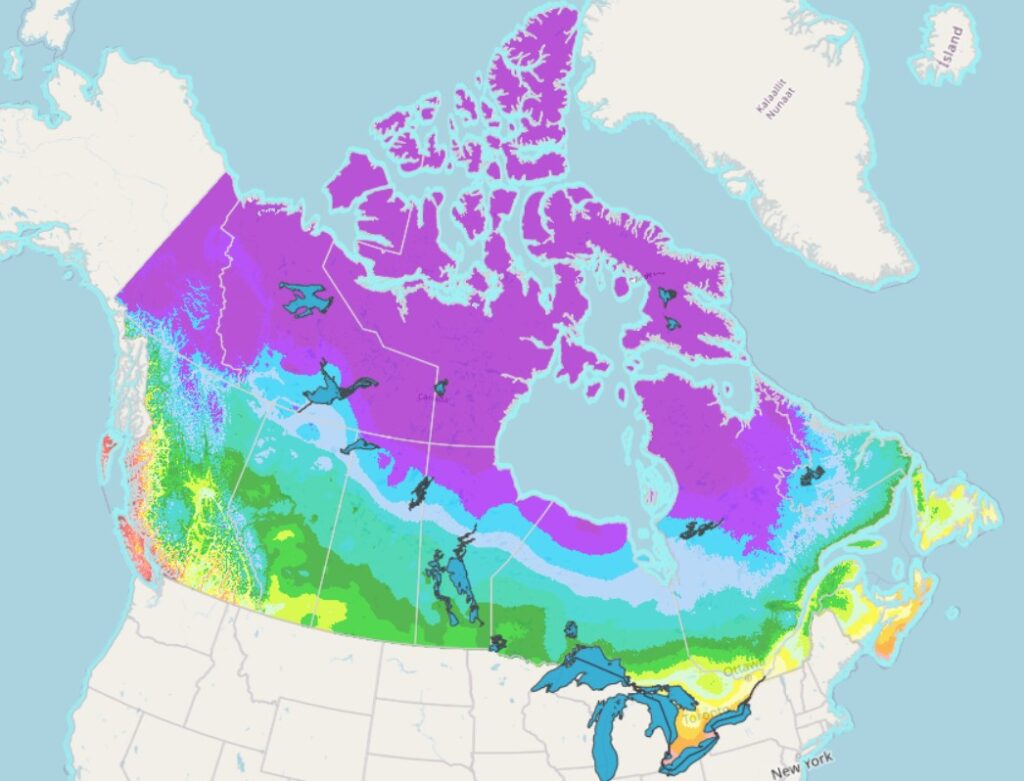
Canada got a new Plant Hardiness Zone Map in 2025, and the headline is not exactly a shock to anyone who has watched their Zone 5 clematis sail through a “Zone 4” winter with room to spare: the country is getting warmer.
The update, led by Natural Resources Canada scientists Dan McKenney and John Pedlar of the Canadian Forest Service, is the first revision since 2014 and uses climate data from 1991 to 2020, replacing the older 1981 to 2010 baseline.
The big movers
Much of the country nudged up by half a zone, which is the climatic equivalent of a gentle shove rather than a dramatic reveal. But a few places moved three half-zones. Coastal British Columbia jumped by as much as three half-zones. Victoria led the pack, moving from Zone 7b in 1991 to a balmy 9a, putting it on par with, and in some cases ahead of, parts of northern California. Vancouver is now sitting at 9a as well. Even Yellowknife got in on the action, climbing a full zone from 0b to 1b. Zone 9a itself is a newcomer: it did not exist anywhere in Canada on the 1961 to 1990 map, and the highest index value recorded in this update, 93.5, still leaves room to climb before the system needs a Zone 10.
There are a couple of areas that went down half a zone, such as in Newfoundland along Bonavista Bay. McKenney and Peddlar confirmed the pattern at the regional level, noting scattered half-zone declines in northeastern Newfoundland, the western shore of Vancouver Island, and a few small pockets across the Prairie provinces. These pockets of cooling are the exception rather than the rule: of the map area that changed at all, 99.6 percent shifted toward warmer conditions.
Why the Canadian system is fussier than the American one
The USDA zones rely on a single number, the average annual extreme minimum temperature. Canada’s system, in contrast, factors in seven variables: minimum temperatures, frost free period, rainfall, snow cover and wind among them. That makes it a better predictor of what survives here, particularly in places with unexpected microclimates. It is not flawless. Prairie growers have long argued the model underestimates the damage from sudden deep freezes, and eastern gardeners point out that wind is still underrepresented.
The seven variables, ranked by importance
For the curious, here is the full list the Canadian formula runs on, weighted in this order:
- Mean minimum temperature of the coldest month
- Frost free period, in days
- Rainfall, June through November
- Mean maximum temperature of the warmest month
- Rainfall in January, since a thaw followed by a hard freeze is rough on roots
- Mean maximum snow depth, which insulates, so more snow actually helps your case
- Maximum wind gust, averaged over 30 years
Every one of those seven measurements was drawn from the same tome period, 1991 to 2020, so the whole index reflects a consistent 30-year climate picture rather than a patchwork of different eras.
More than a gardening tool
The Canadian hardiness zones are important for more than backyard planning. They inform agriculture, forestry, insurance risk models and the tracking of invasive species and pests. The hemlock woolly adelgid, for instance, correlates closely with Zone 4a conditions, while threats like spruce budworm and emerald ash borer are also climate linked. NRCan’s mapping technology can now estimate climate values for specific GPS coordinates, feeding models that predict where a species might thrive today and where it may thrive next, as the climate keeps shifting under our feet.
Where to look it up
The updated maps, along with species specific habitat models and a way to submit your own plant sightings, live at planthardiness.gc.ca. You can also look up a specific municipality on the website to see a zone now and from before the update.
The takeaway
Climate change is not an abstraction on this particular map. It shows up as real Zone shifts, concentrated in the west but present nearly everywhere. For gardeners, farmers and foresters, the new zones are equal parts planning tool and preview of a warmer future. And for gardeners in the handful of spots that cooled instead, like the Bonavista Peninsula, they are also a reminder that the climate changes are full of surprises.
Source
McKenney, D.W., Pedlar, J.H., Lawrence, K., DeBoer, K., & MacDonald, H. (2025). Updated plant hardiness zones for Canada and assessment of change over time. Scientific Reports, 15, article 22774.